Progress tracking, made simple
How does it work?
By tracking your heart rate in real-time, we ensure you’re training at the right intensity to hit your goals—whether that’s burning fat, building endurance, or smashing a personal best.
What are BEAT Points?
What are Sweat Points?
What are Recovery Points?
Why Max Heart Rate?
My heart rate zone feels off. What should I do?
How do we calculate calorie burn?
Progress Tracking FAQ
Your total fitness score
BEAT Points combine two metrics into one powerful number:
Sweat Points + Recovery Points = BEAT Points
• Sweat Points measure how hard your heart is working in the moment. The harder you push, the more Sweat Points you earn.
• Recovery Points measure how quickly your heart rate drops after intense exercise. As you get fitter, your heart recovers faster.
Why this combination matters
This score captures both sides of your fitness—the effort you put in and how your body adapts. By combining effort and recovery into one number, BEAT Points show you not just how hard you’re training, but exactly how that training is paying off. Together, they give you the complete picture of your fitness.
How to interpret your BEAT Points
In a single session
Higher BEAT Points → you spent meaningful time in higher-intensity zones and your heart recovered well at the end.
Moderate BEAT Points → a balanced effort, common during strength-dominant or steady sessions.
Lower BEAT Points → intentionally easier work, or a day where fatigue, sleep, or stress influenced your effort or recovery.
A "low" score is not a failed workout — it just reflects a different training stimulus or a different day for your body.
Over time
Long-term trends (in similar workouts) are what matter:
Trending up -> Suggests your body is adapting — you're able to work harder, recover faster, or both.
Staying steady -> Often a sign of consistent training and stable cardiovascular conditioning.
Trending down -> May reflect fatigue, stress, illness, poor recovery, or an imbalance in training load. A cue to adjust sleep, hydration, or session intensity — not a reason to panic.
💡 Pro Tip: Look at both numbers, not just the total. High Sweat Points show you gave it your all today. High Recovery Points show your training is paying off over time. The best workouts? Strong on both.
Your personal effort score
Sweat Points measure how hard your heart is working during a workout based on the time you spend in each heart-rate zone, and turn that into a simple, comparable number. Calculated from your personal max heart rate, they reflect the effort you put into your workout, offering a consistent way to understand intensity across workouts.
Forget calories. Forget raw heart rate. Sweat Points reward your effort, not your fitness level.
Why Sweat Points?
Raw heart rate can be misleading—160 bpm can feel like a moderate push for one person but a max-effort sprint for another. Similarly, calorie counts are often broad estimates based on body size rather than the actual internal work you are doing.
Sweat Points calculate effort based on your unique maximum heart rate. This personalizes your data to your specific physiology, ensuring your score is always a true reflection of your intensity. Whether you are 25 or 50, you get an accurate, meaningful way to track your personal progress and ensure you're training at the right level for your body.
How Sweat Points are calculated
You earn points for every full minute spent in each heart rate (HR) zone:
• DARK RED zone (91–100% of max HR) -> 4 points
• LIGHT RED zone (81–90 of max HR) -> 3 points
• DARK BLUE zone (71–80% of max HR) -> 2 points
• LIGHT BLUE zone (≤70% of max HR) -> 1 point
The higher the zone, the more Sweat Points you earn. This turns your effort profile into a number that’s easy to compare across days, formats, and phases of training.
How to interpret your Sweat Points
In a single session
• High Sweat Points → Sustained time in high-intensity zones (e.g., in BURN or HYBRID).
• Moderate Sweat Points → Controlled, steady intensity (great for building base fitness or strength-focused days).
• Lower Sweat Points → Intentional recovery, technical focus days, or days where fatigue limits how high your HR climbs.
Over time
Sweat Points tell you about effort, not fitness — so interpret them with that nuance, always considering the same workout type:
• Stable or rising Sweat Points -> You’re able to consistently work at high relative intensity.
• Lower despite trying to push -> Can indicate under-recovery, stress, illness, poor sleep — or that you’ve raised your fitness baseline and need more power/speed to hit higher zones.
• Stay moderate while workouts feel easier: A sign your aerobic conditioning is improving — your body has become more efficient at the same workload.
💡 Pro Tip: Don't just chase the red zone. Good training means moving between zones, particularly with different workout formats. Your body gets stronger through alternating effort and recovery — not constant max effort.
Your cardiovascular fitness score
Recovery Points measure how quickly your heart calms down after going all-out. This is one of the most reliable indicators of cardiovascular health — and proof that your training is working.
The science
Recovery Points measure heart rate recovery (HRR) — one of the clearest indicators of cardiovascular fitness. A faster recovery after effort often reflects stronger cardiovascular conditioning.
A well-trained heart is efficient. After intense effort, it doesn't need to keep racing — it recovers quickly.
Elite athletes might drop 40+ bpm in a single minute. If you're just starting out, 15–20 bpm is completely normal. The exciting part? This number improves with consistent training.
How Recovery Points are calculated
At the end of your workout:
1. You perform a 1-minute challenge where your peak heart rate is recorded (e.g. 166 bpm).
2. In the following minute, we track the lowest heart rate you reach (e.g. 132 bpm).
3. Recovery Points = Peak HR − Lowest HR after 1 minute.
A higher number = a faster drop = stronger recovery.
How to interpret your Recovery Points
In a single session
• High Recovery Points -> Your heart is recovering quickly — often a sign of good cardiovascular conditioning and/or that you arrived well-rested.
• Moderate Recovery Points -> Normal after a demanding workout, a big push near the end, or days when you’re not fully rested.
• Low Recovery Points -> Often influenced by fatigue, dehydration, stress, illness, or continuing to move during the recovery minute (e.g., walking around).
Not a verdict on your fitness — just feedback on today’s physiology.
Over time
Recovery Points are most valuable in long-term patterns:
• Trending up across similar workouts -> Strong sign that your cardiovascular fitness is improving.
• Holding steady while your workouts get harder -> Great sign — your recovery system is keeping up.
• Trending down persistently -> A signal to adjust training load, sleep, or stress.
This is how HRR is used in elite training environments — to balance effort with recovery.
💡 Pro Tip: This is THE metric to watch over months. Sweat Points can vary from workout to workout depending on how hard you push. But steadily climbing Recovery Points? That's undeniable progress — your heart is literally getting stronger.
What are low, moderate and high Recovery Points?
• <18 -> Low recovery. Building up your base - keep showing up to see improvements.
• 18-29 -> Moderate recovery. Solid fitness foundation.
• 30-40 -> High recovery. Strong cardiovascular conditioning.
• >40 -> Excellent recovery. Athlete-level fitness.
Your heart rate is unique to you — that’s why we personalize your training zones instead of using fixed numbers.
For your first workout, we estimate your maximum heart rate using a standard age-based formula (220 minus your age). This gives us a starting point, but it’s only an estimate. As you train with us, we learn how your body actually responds and your zones become more accurate over time.
Because everyone’s heart rate behaves differently, raw numbers aren’t meaningful on their own — 150 bpm can feel easy for one person and intense for another. That’s why we show your effort as a percentage of your personal maximum heart rate, so you can understand how hard you’re working relative to your own capacity.
At BEAT81 we calculate two types of calorie burn:
We use the Keytel formula to calculate your Gross Calorie Burn, meaning calories burned during exercise. We then use the Harris-Benedict formula to calculate your Basal Metabolic Rate: how many calories you would have burned resting. Finally, subtracting your “resting” calories from the gross calories you burned during the workout gives us the calories you burned during your BEAT81 workout.
- Calorie burn during the workout
- Calorie burn after the workout due to the after-burn effect
01 - Calorie burn during the workout
We use two standard formulas here:
- Keytel formula for calculating heart rate with an unknown VO2 Max
- Calorie burn after the workout due to the after-burn effect
Keytel Formula used to calculate Gross Calorie Burn:
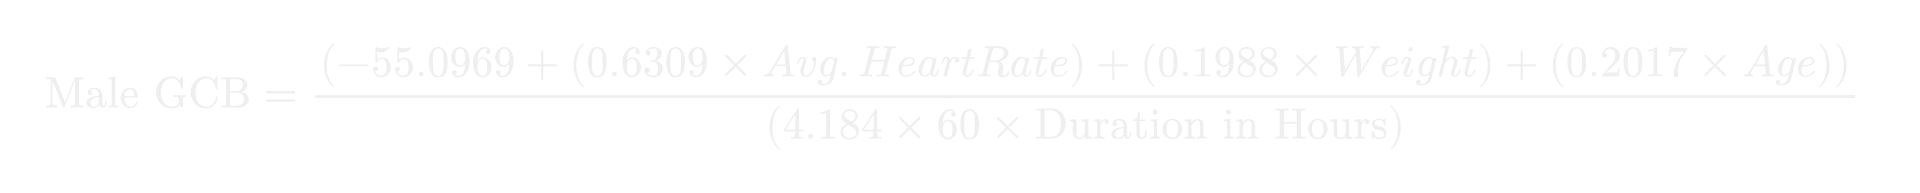

Harris-Benedict formula used to calculate Basal Metabolic Rate (calories burned per 24 hours):


Calculating the Resting Metabolic Rate calorie burn for the workout duration:

Calculating calorie burn during a workout:

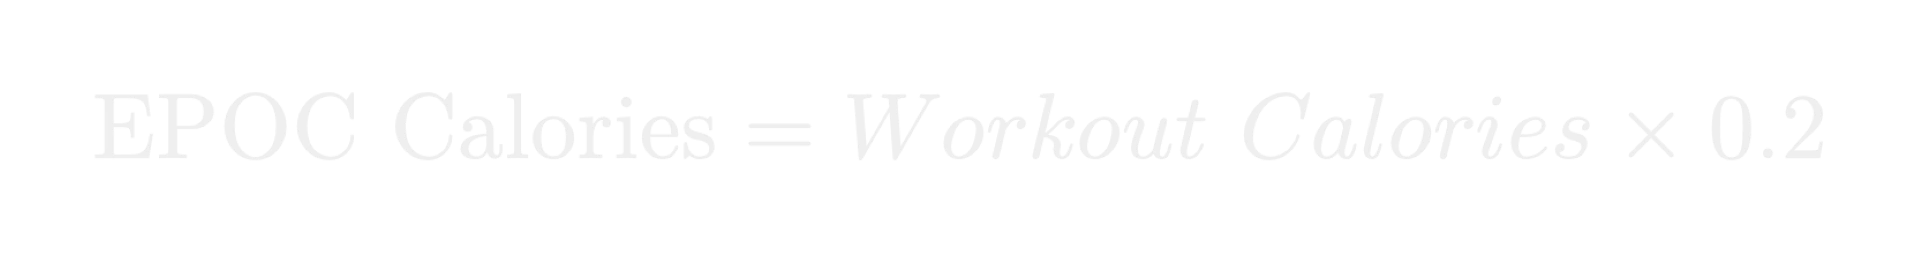
02 - Calorie burn after the workout
When you exercise close to your maximum heart rate your body requires additional O2 after the workout to recover - this is called excess post-exercise oxygen consumption (EPOC). Your EPOC is bigger the more minutes you train close to your maximum heart rate. Therefore, the longer you train above 80% the more calories you burn via EPOC after the class.
Trained above 80% for less than 8.5 minutes
Trained above 80% for more than 8.5 minutes

Trained above 80% for more than 16.5 minutes
The total calories you burn thanks to the class is the sum of workout calories and EPOC calories.
The 4 colors align with the percentage of your maximum Heart Rate (max HR):
- Light blue zone: ≤70% of max HR
- Dark Blue: 71-80% of max HR
- Light Red: 81-90% of max HR
- Dark Red: 91-100% of max HR
During your session, they help you understand the effort you're putting in. It's up to you to if you aim to push harder or recover better.
Entering your height, weight and age allows us to calculate your calorie burn and heart rate at our workouts more accurately and allows you to use the heart rate sensors at our workouts and to enjoy the full BEAT81 experience.
Heart rate tracking helps you train at the right intensity for you – not too easy, not too hard.
Your heart rate zones are personalized to your fitness level. During the workout, you'll see which zone you're in on the studio screens. This helps you:
- Find your own pace – push when you're ready, ease off when you need to
- Avoid overdoing it – especially useful in your first sessions while you're learning the format
- See progress over time – as you get fitter, you'll recover faster and handle higher intensities more comfortably
💡 Important: Heart rate tracking is a guide, not a rulebook. How you feel always comes first. If the zones don't match your experience, trust your body – the system learns and adjusts over time.
And if you'd rather not track? That's completely fine. You can join any class without a sensor and simply train by feel. Many people do.
- Moisten the plastic portion of the strap
- Snap the sensor until it clicks with the number right side up
- Position the sensor in the center of the chest
- The height should be at the ‘bra-line’ or equivalent
- The plastic portion of the strap needs to touch the skin (under the sports bra!)
- Fasten the strap tight enough so it does not move


The dark red zone represents near-maximum effort – it's effective for short bursts, but not the goal of every workout or every interval.
For everyone: Time in the dark red zone can build power and push your limits, but your body also needs time in lower zones to recover, build aerobic capacity, and adapt. A balanced training week includes sessions and moments across all zones – not just the top end. Spending too much time in dark red, session after session, can lead to fatigue, slower recovery, and diminishing returns.
If you're newer to BEAT81: There's no pressure to hit dark red in your first sessions. Start by getting comfortable with the format, the movements, and how your body responds. Training at a moderate pace (blue and light red zones) for your first few sessions is a smart way to build a foundation. As you get more confident, you can push higher when it feels right.
If you're experienced: You likely know when to push and when to pull back. Use dark red strategically – for peak intervals, challenges, or days when you're fresh – rather than as a default. If you're always in dark red but feeling drained, it may be worth dialing back to let your body catch up.
The bottom line: All zones contribute to your fitness. Dark red is a tool, not a target. Trust how you feel, mix your intensities, and give your body room to recover.
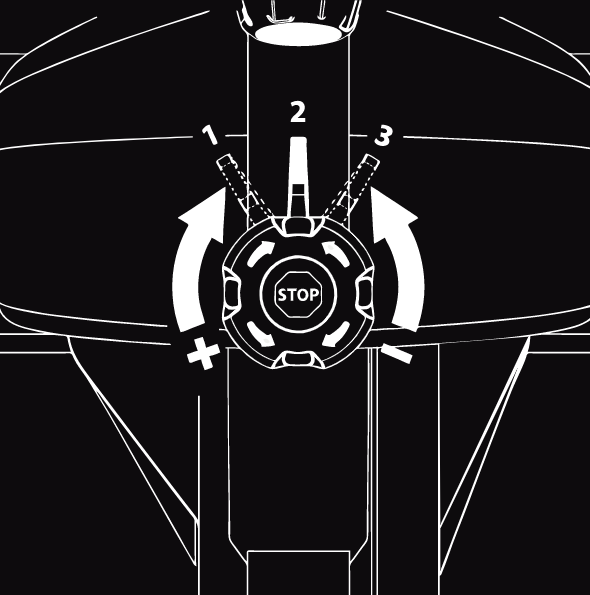
Your spinning bike works with resistance to simulate riding a bike on a flat road, uphill or downhill.
The knob (or dial) in the center can be turned to the right to increase resistance or to the left to decrease resistance. Turn it halfway to feel a difference. You can also always press the knob down to stop your bike completely.
When you get on your bike the resistance is set to 0 (or “downhill”) - which we will never use at a BEAT81 workout. Therefore always turn the knob to the right until you feel some resistance. You are now on the flat road.
Now it gets interesting: above the knob there is a lever (or SprintShifter), which allows you to significantly increase resistance to simulate hills (or a mountain). The default setting is on the left (or “1”). By moving the lever to the middle (or “2”) you increase the resistance by 70%. Moving the lever to the right (or “3”) increases resistance by 100%.
During the ride our coaches will instruct you when to increase or decrease resistance using the “dial” or the “shifter”.